
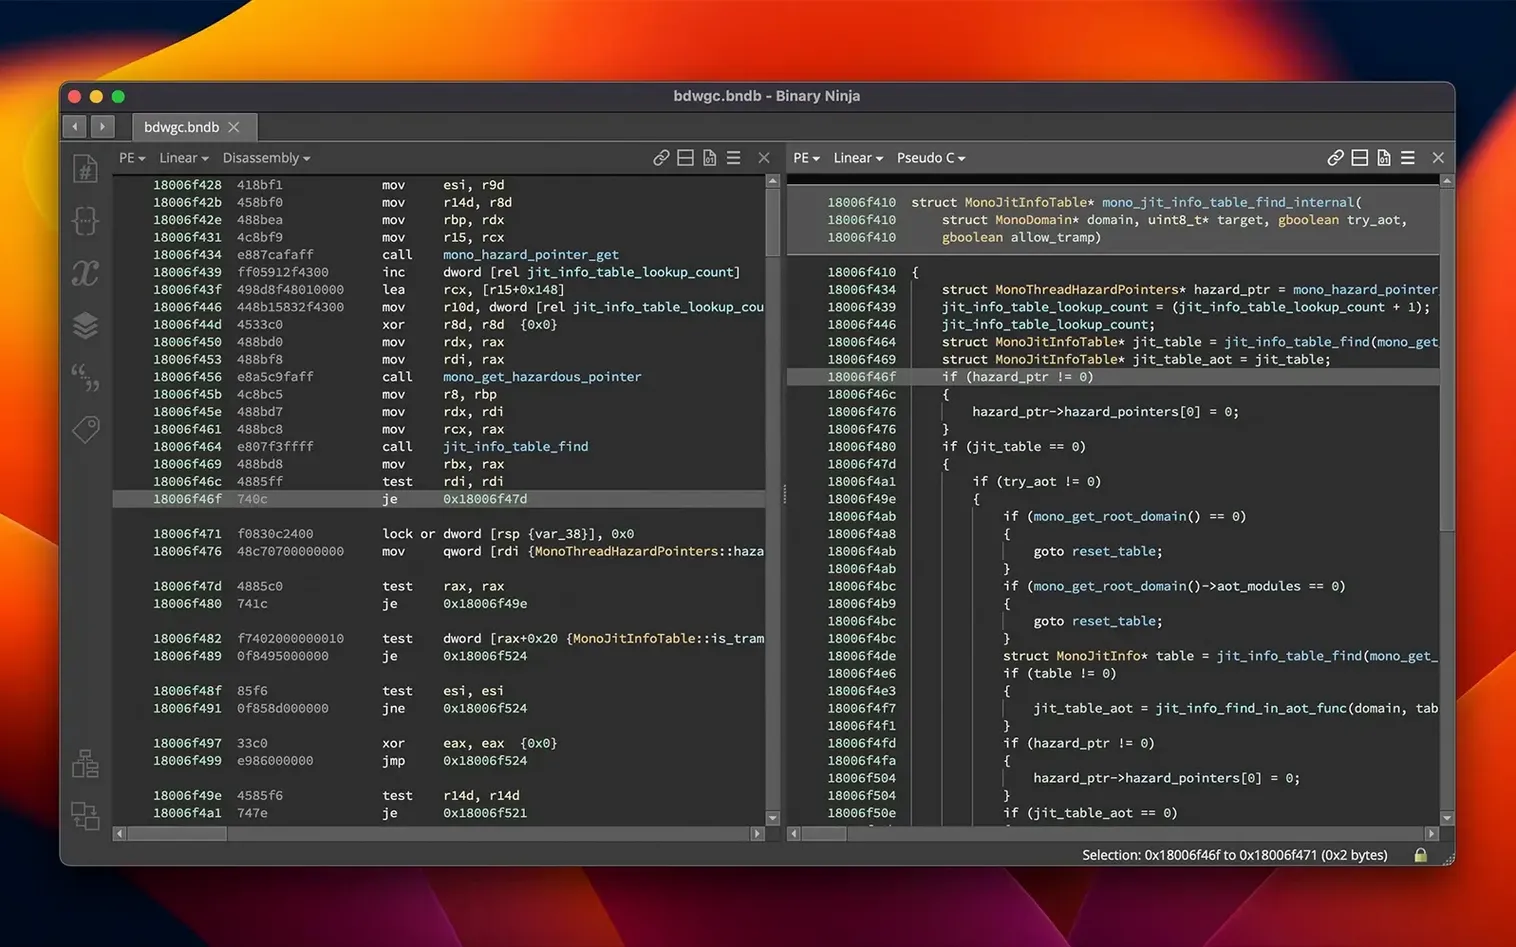
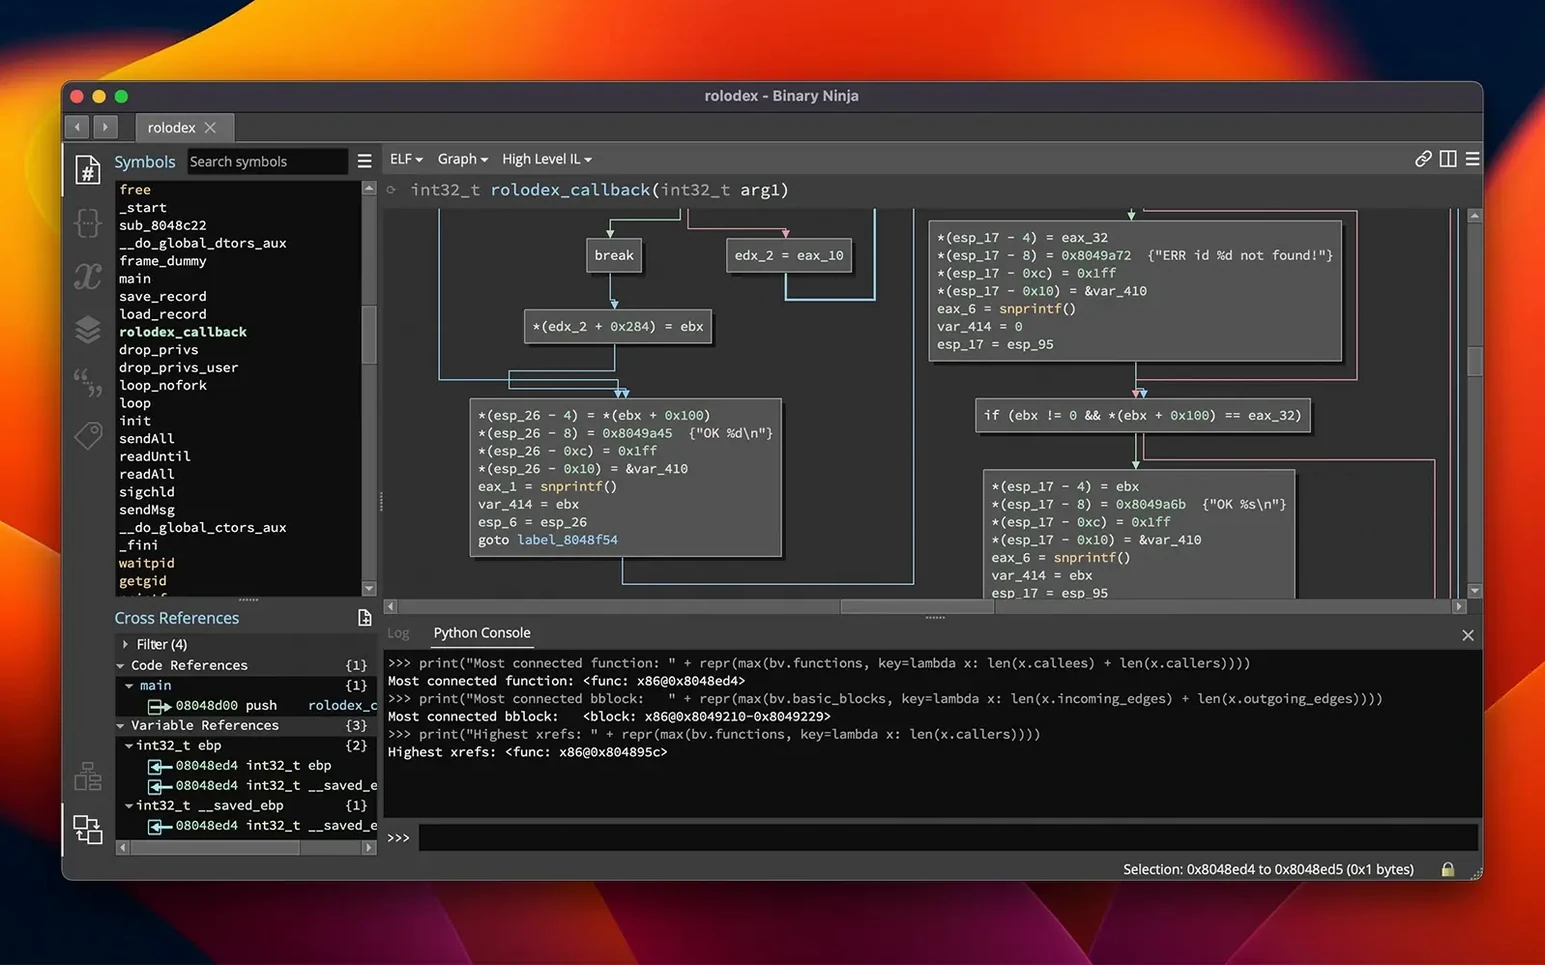
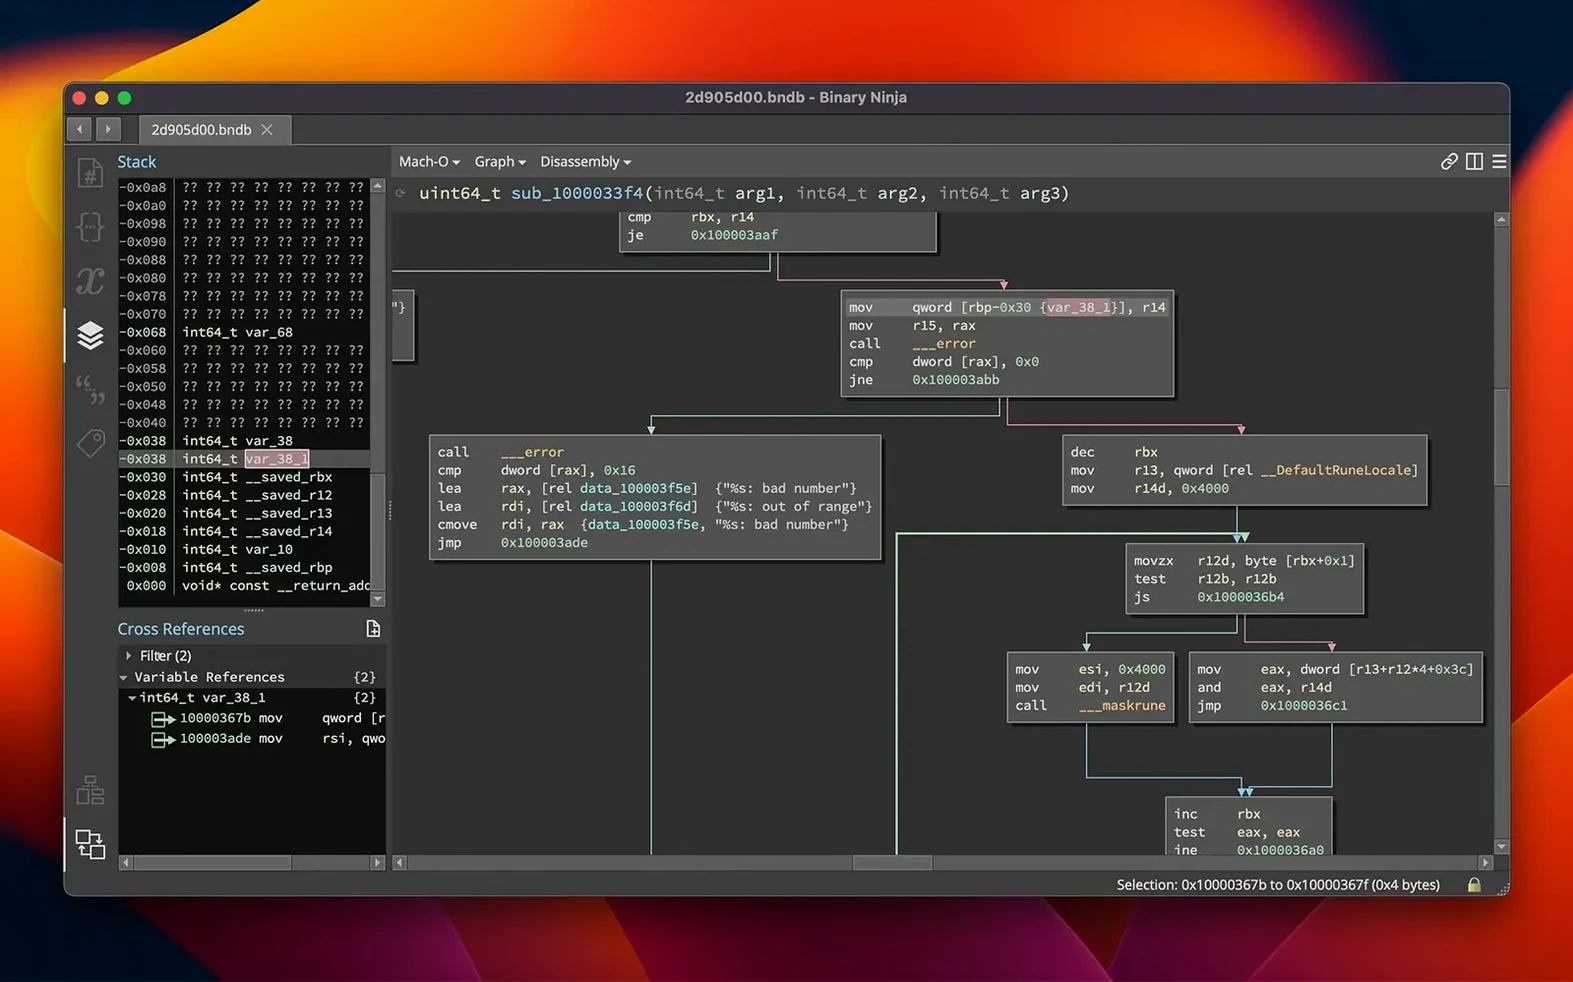
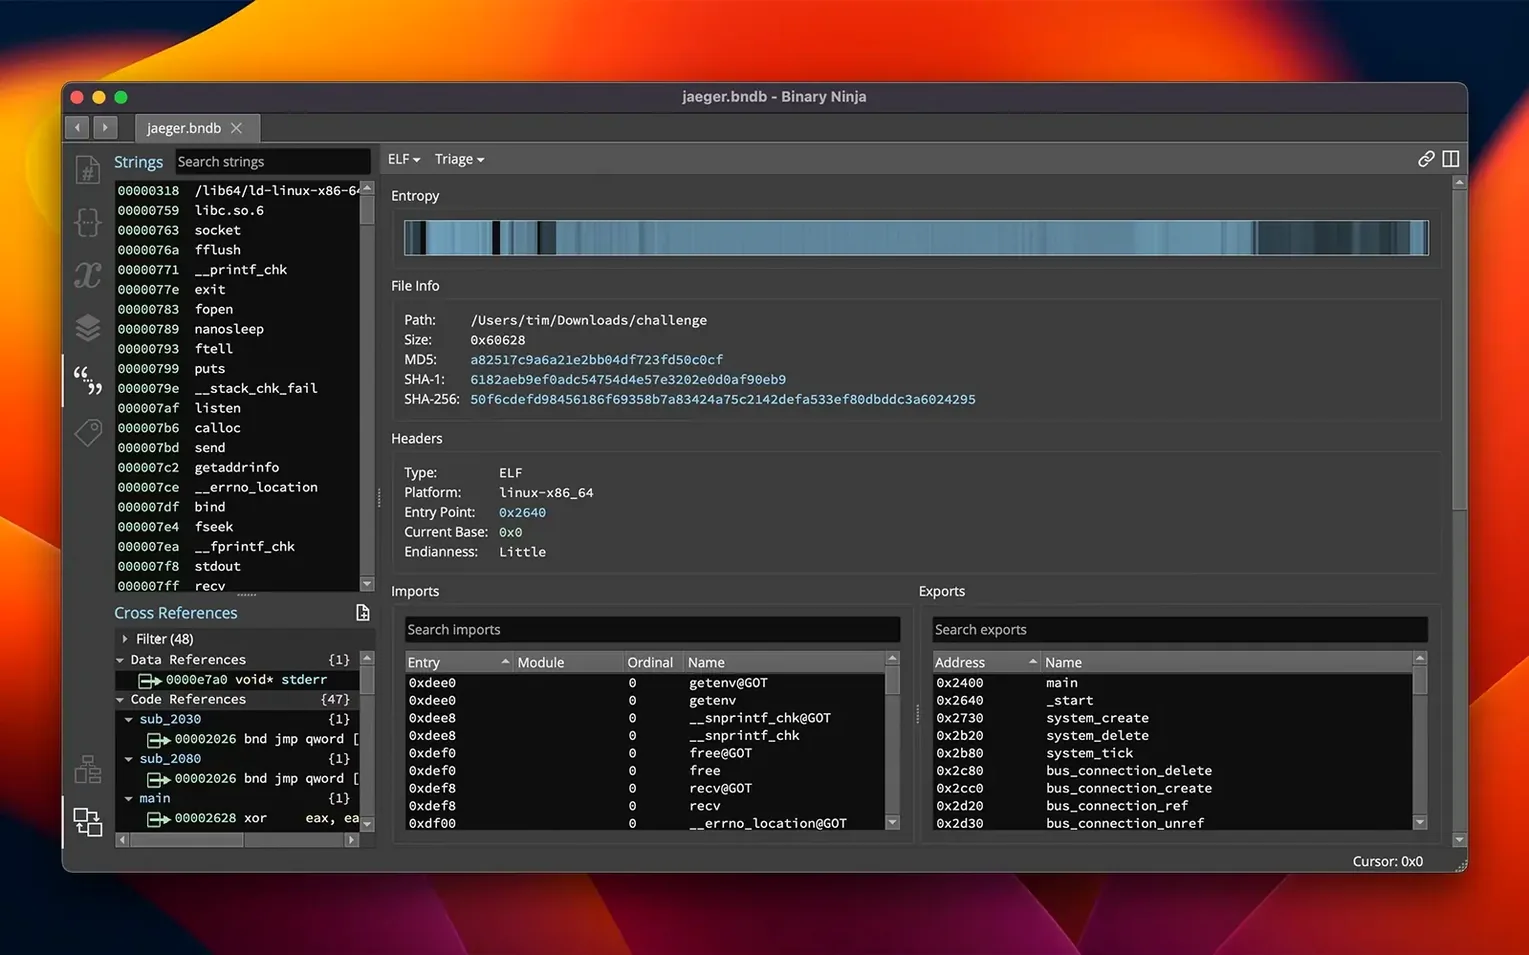
Security researchers, vulnerability hunters, and developers trying to understand code without source turn to Binary Ninja. It’s a reverse-engineering platform that pairs a disassembler with a decompiler and a whole workshop of binary analysis tools.
Disassembly — turn raw machine code into readable assembly for ARM and x86 64-bit architectures.
Decompilation — lift that assembly into a high-level IL that reads closer to C, so you can name variables, apply types, and build structures.
Binary patching — edit assembly instructions, apply preset patches, tweak raw hex, or compile C snippets with the built-in SCC compiler.
Headless analysis — run the engine without the user interface, scripted through APIs for C++, Python, and Rust.
Cross-references and control flow — click through function calls and branches on an interactive graph that maps how code actually runs.
Loaders — open PE, Mach-O, and ELF binaries without extra setup.
Extend it — the redesigned Extension Manager puts community plugins a few clicks away.
Tweak these preferences to cut friction on day one
Out of the box, Binary Ninja makes reasonable choices, but a few tweaks in the preferences dialog save time and friction once you settle into a project. Open Settings from the Edit menu and look at these right away:
- Analysis > Enable automatic analysis. On by default, and you usually want it that way. If you load a large firmware blob just to check a single function, switch it off first — the analysis queue won’t grind through megabytes you don’t need yet.
- Display > Font. The default monospace font is serviceable, but picking something like JetBrains Mono or Fira Code makes long decompilation listings easier on the eyes. Do it now rather than squinting through a weekend session.
- Updates > Channel. Set to “stable” unless you want to chase fresh features. The 6.0 release brought the migration wizard for a reason — dev channel builds can shift under you.
- Shortcuts. Spend three minutes scanning the keybindings. Mapping “Show cross-references” to something you can hit without looking at the keyboard pays off every time you chase a call chain.
A malware analyst’s first ten minutes
Imagine someone handed you a suspicious Mach-O binary and a note that says “check the installer stub.” You drag the file into Binary Ninja. The entropy graph paints a spike near the end of the data segment — packed or encrypted payload, probably. You click the spike, and the hex view confirms a blob that doesn’t resemble normal instructions.
You scroll to the entry point instead. The decompiler shows a handful of function calls wrapped in string references that look like file paths. One call grabs a temporary directory path, another constructs a filename with a random suffix. You rename the variable dropper_path and apply a structure you pulled from the Extension Manager last week. Cross-references lead to a small function that calls chmod and execve. The story assembles itself: the stub writes a payload, sets executable permissions, and runs it. Ten minutes in, you have enough to write the first paragraph of a report — no source required.
An hour inside an ARM firmware image
You start a fresh analysis on an ARM firmware image, the kind where Binary Ninja for Mac cracked doesn’t mean anything until you see the instruction encoding. Here’s how a typical hour flows:
1. Open the binary. Binary Ninja recognizes the ELF header and loads the ARMv7 architecture automatically. You let the initial analysis finish — the status bar ticks through function detection in under a minute.
2. Find the interesting code. You search for a string you spotted in a log file: “auth failure.” The cross-references panel drops you into a function full of conditional branches. You switch to the graph view and see a decision tree that checks a sequence of bytes against hardcoded constants.
3. Rename and annotate. You give the constants meaningful names — expected_magic, max_retries — and the decompiler output immediately reads like pseudocode someone wrote on purpose. You add a comment above the loop: “Retry counter resets after three bad attempts.”
4. Patch a test build. You want to bypass the retry limit for testing. You right-click the comparison instruction and pick “Invert branch condition.” The assembly edits in place. You save the patched binary and push it to the test device. The loop now never exits — exactly what you needed for a fuzzing harness.
5. Export the findings. You select the annotated function and export it as a C snippet through the decompiler. The types and variable names carry over. A colleague will pick it up in the morning and run headless analysis on a batch of related samples overnight.
Bottom line: the tool doesn’t force you into one workflow. You move from hex to graph to decompiler as the questions change, and the annotations stay with the binary the whole way.
Version 6.0 is a big one. It adds an MCP server, a new Binary Similarity feature, a redesigned Extension Manager, and support for the TMS320C6x architecture. Under the hood you get memory and performance improvements, a refactored calling convention, and HLIL structure initializers.
- macOS 10.15 or later
- Intel or Apple Silicon Mac
Notes from the tables 0
Sign in or pull up a chair to leave a note.
No notes on this one yet. They go up after I read them.